— About this Project —
I designed and built this software tool to support exploration of data about emotional arousal, activity and behavior of children in a special education. The goal is to help teachers, caregivers and researchers better understand the needs of children who have a difficult time communicating about and managing their emotions.
— Background —
For people with autism self regulation of emotional arousal can be a significant challenge, as can communicating about emotional state. Electrodermal activity (EDA) or skin conductivity is a result of changes in autonomic nervous system activation. It can be measured as a proxy for emotional arousal. The Q Sensor, developed by the Affective Computing Group at the MIT Media Lab measures EDA in an ambulatory setting. Using this sensor, researchers can explore the connections between behavior and EDA. This can be very useful for understanding more about individual students’ behavioral triggers and emotional needs are. Researchers collected several months of EDA data, as well as information about children’s behavior and activities to explore these questions. I designed a visualization tool for exploratory analysis of this large body of data by the Affective Computing Group at the MIT Media Lab. You can read a brief publication about this project here.
— Design —

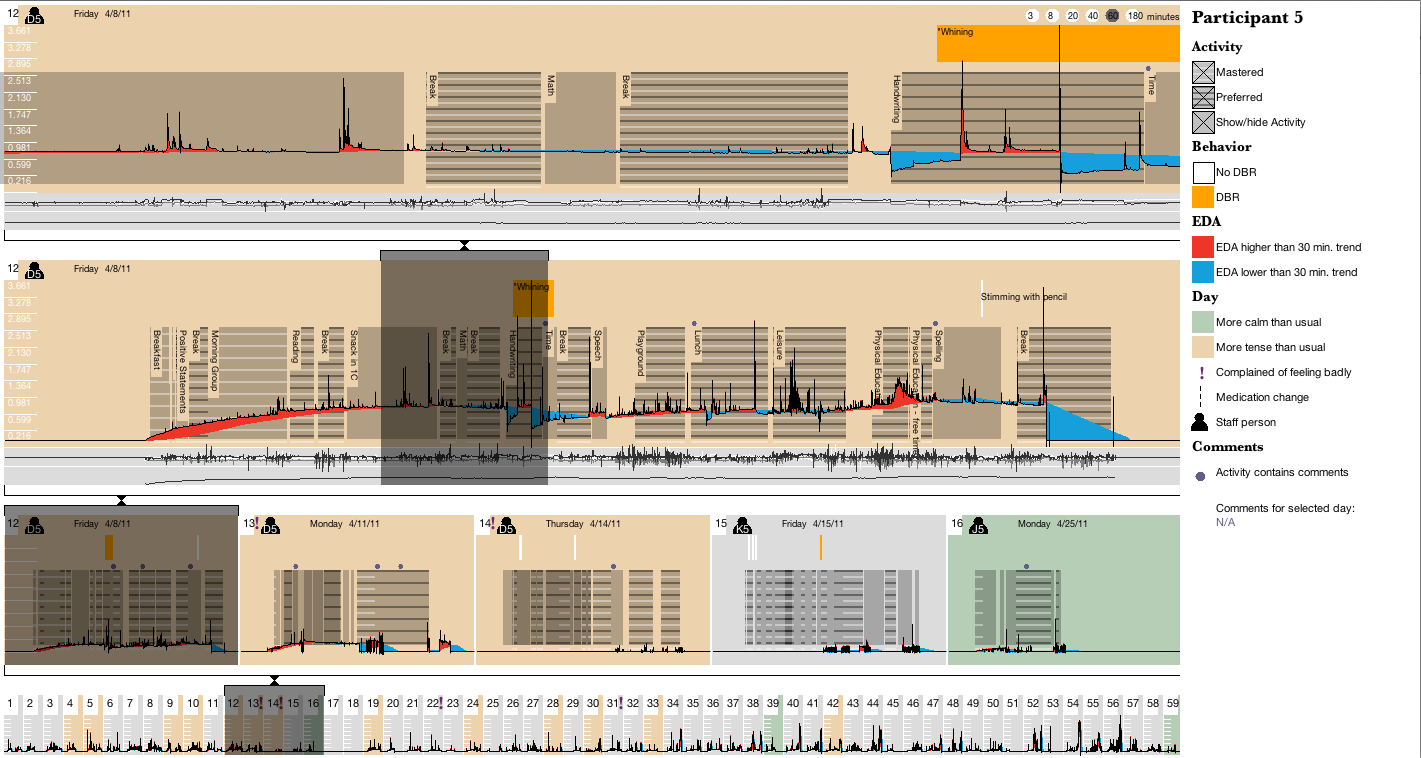
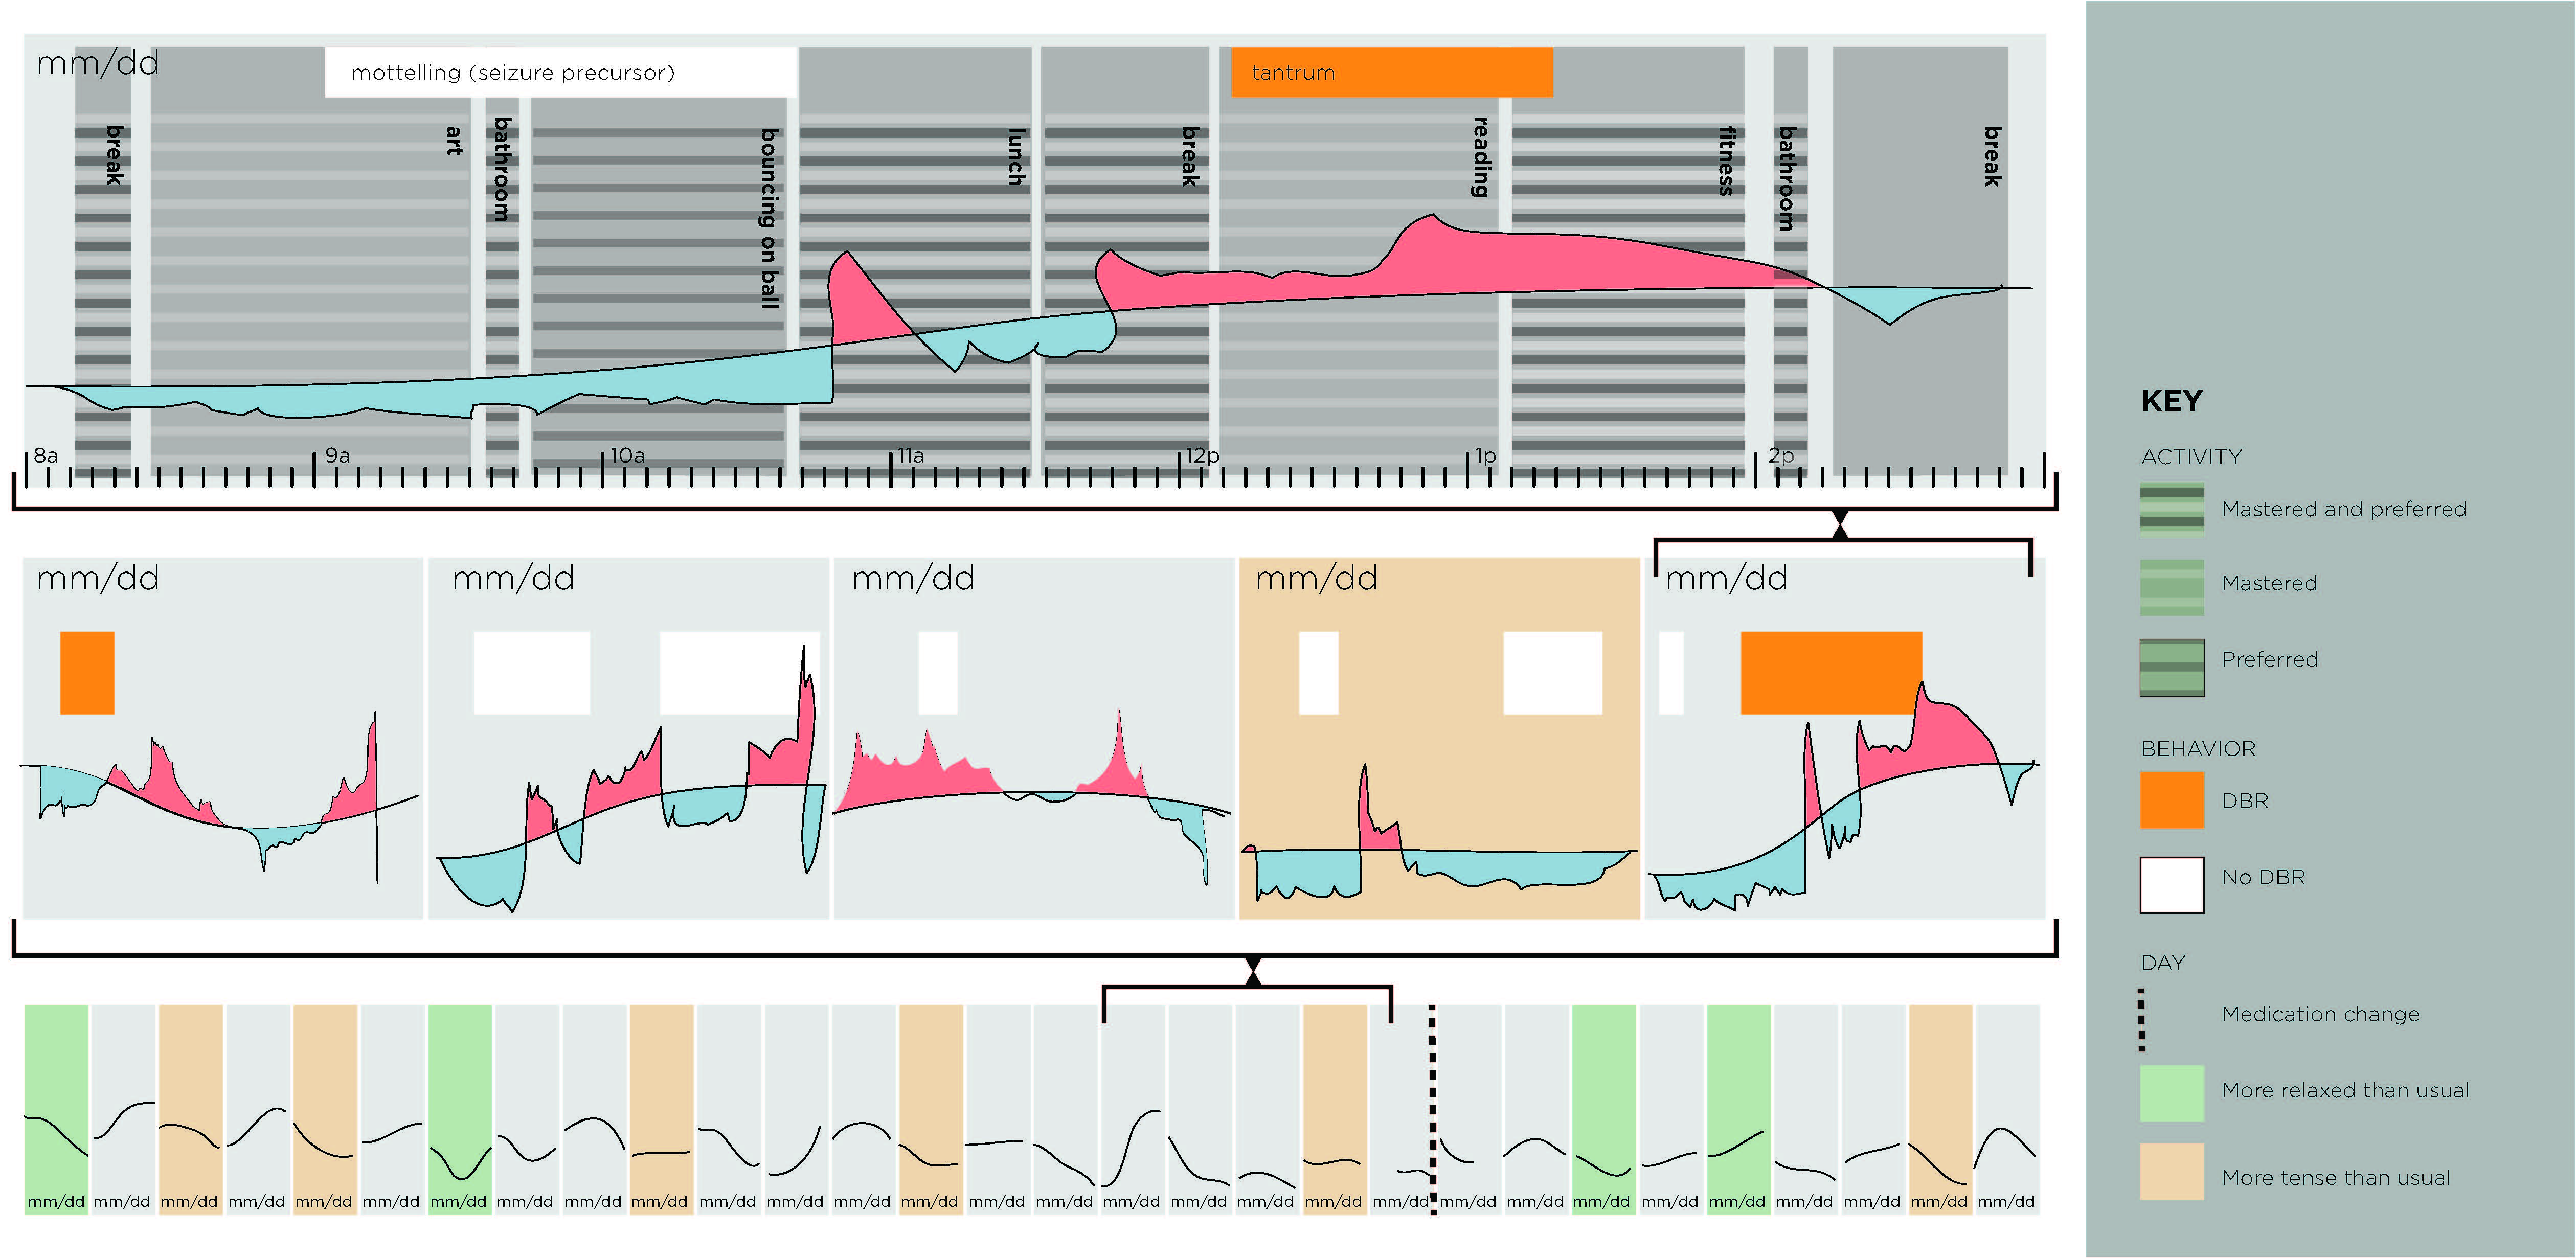
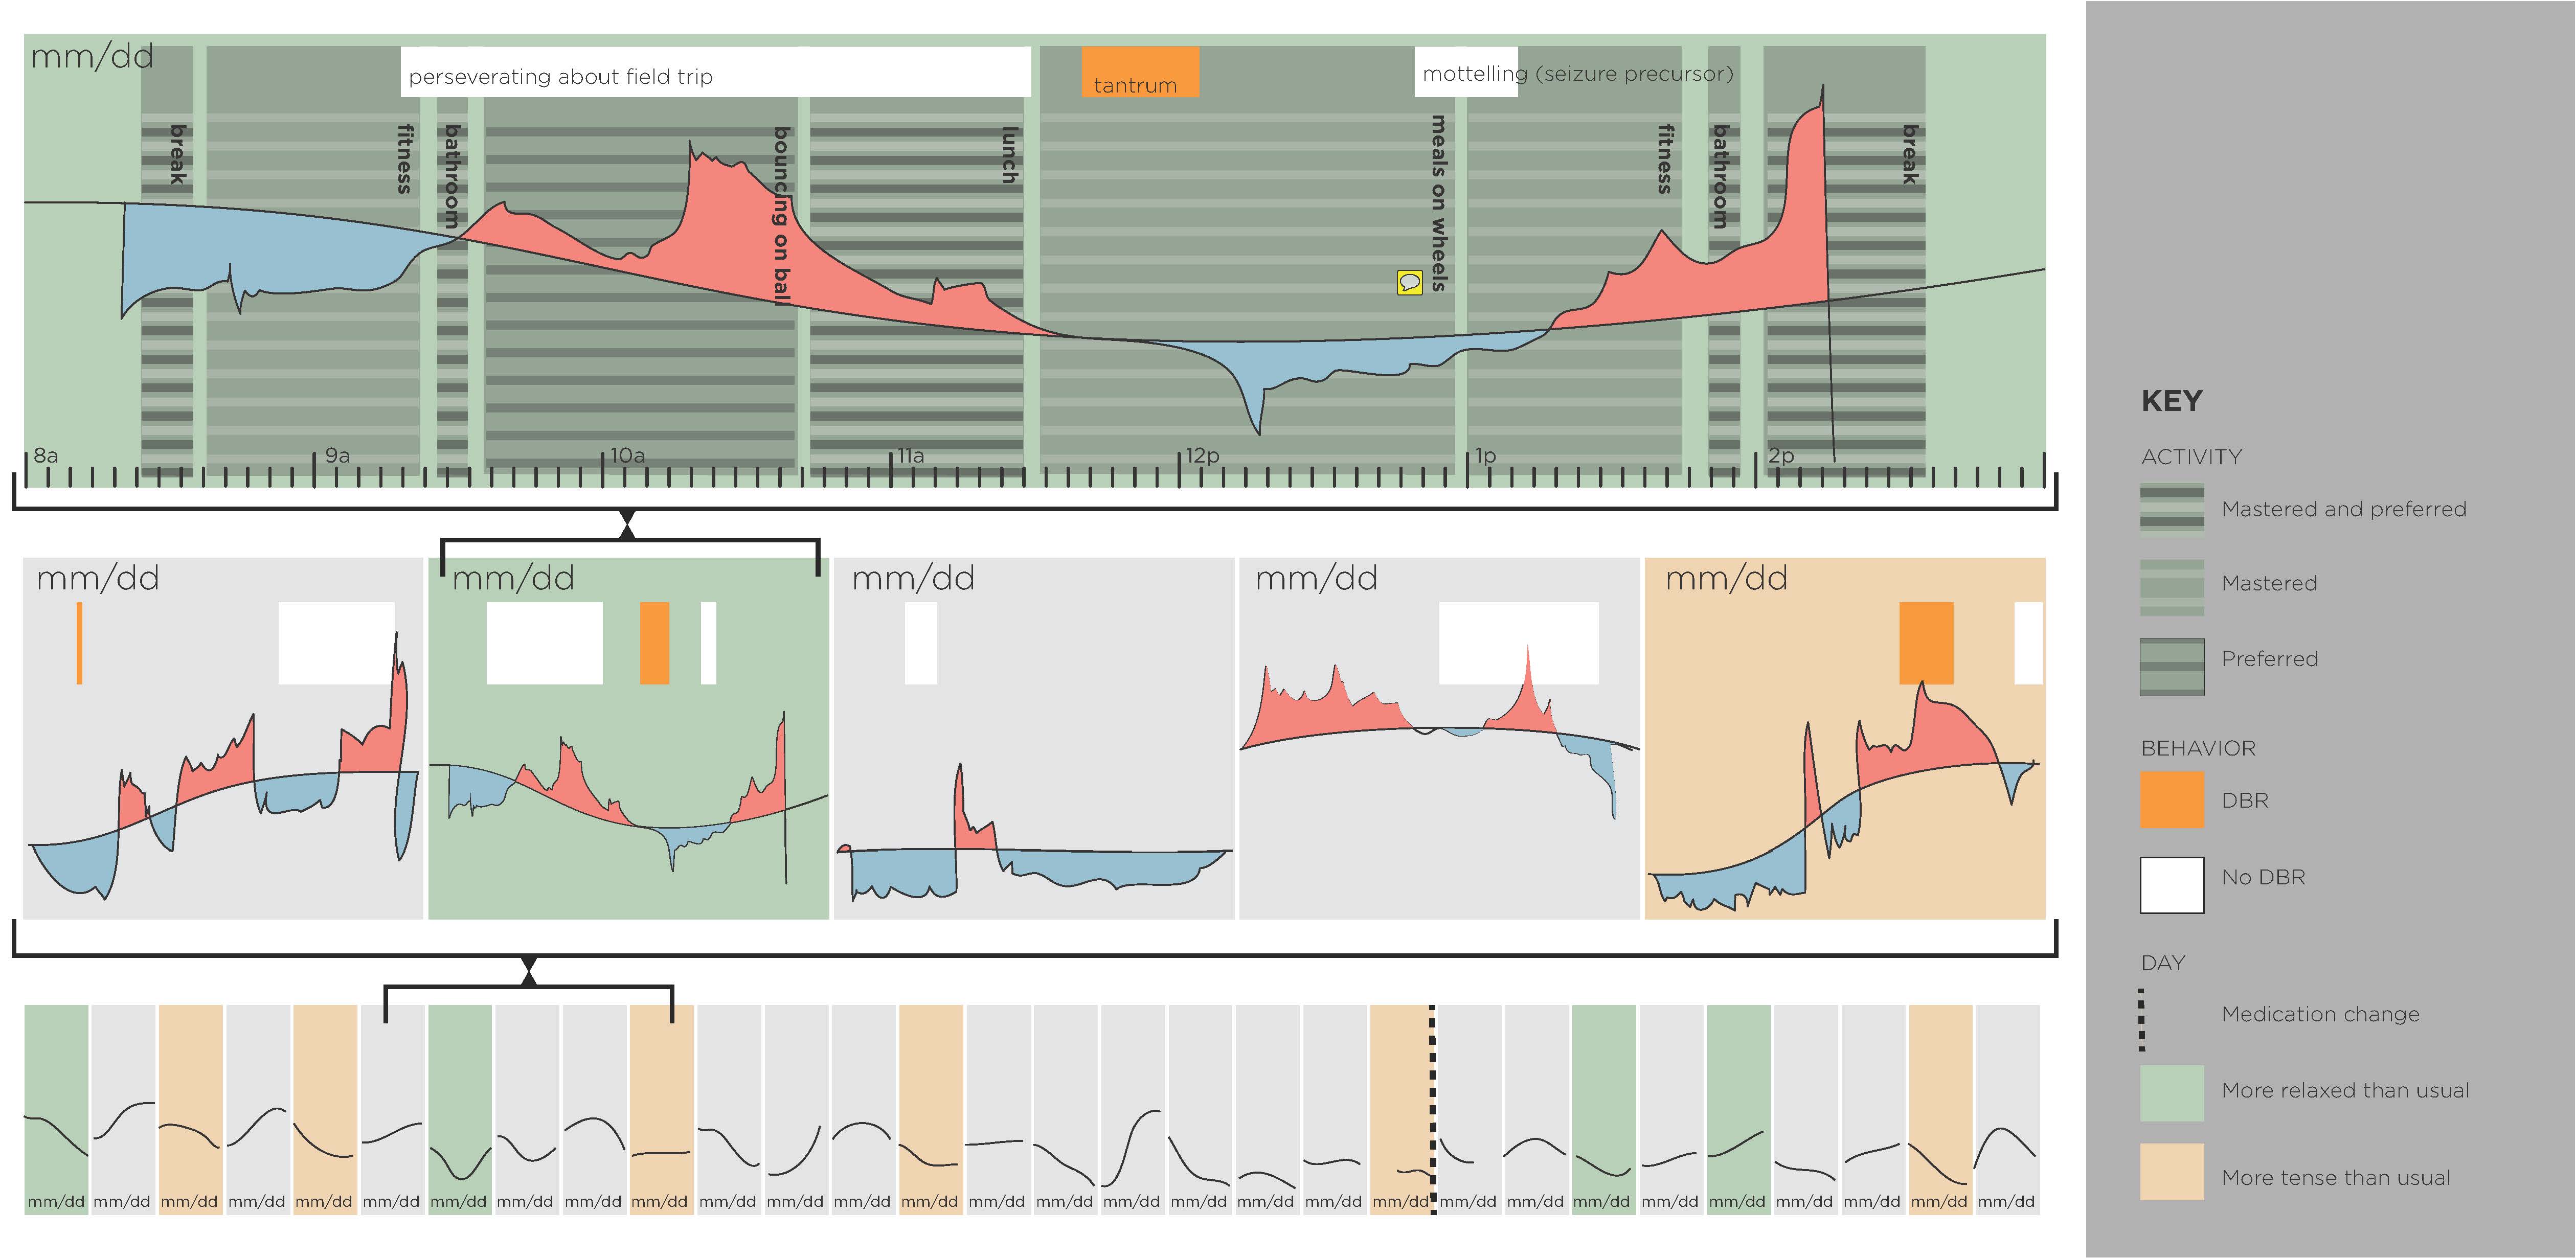
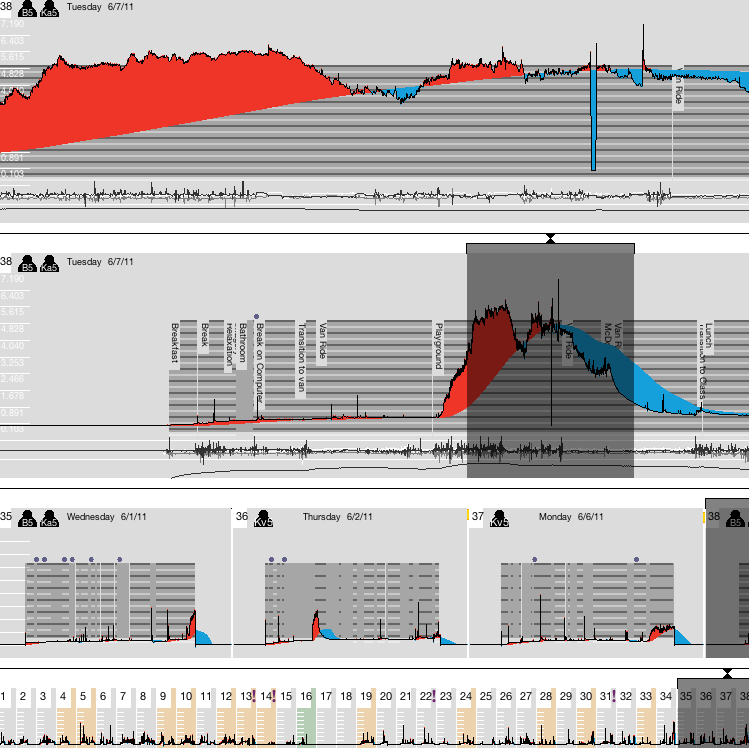
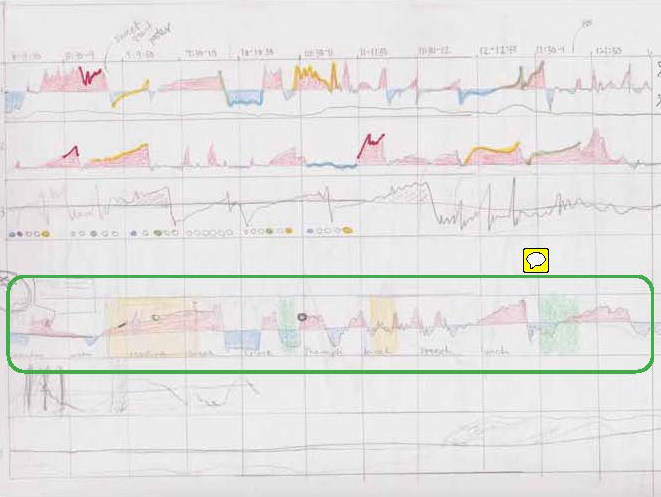
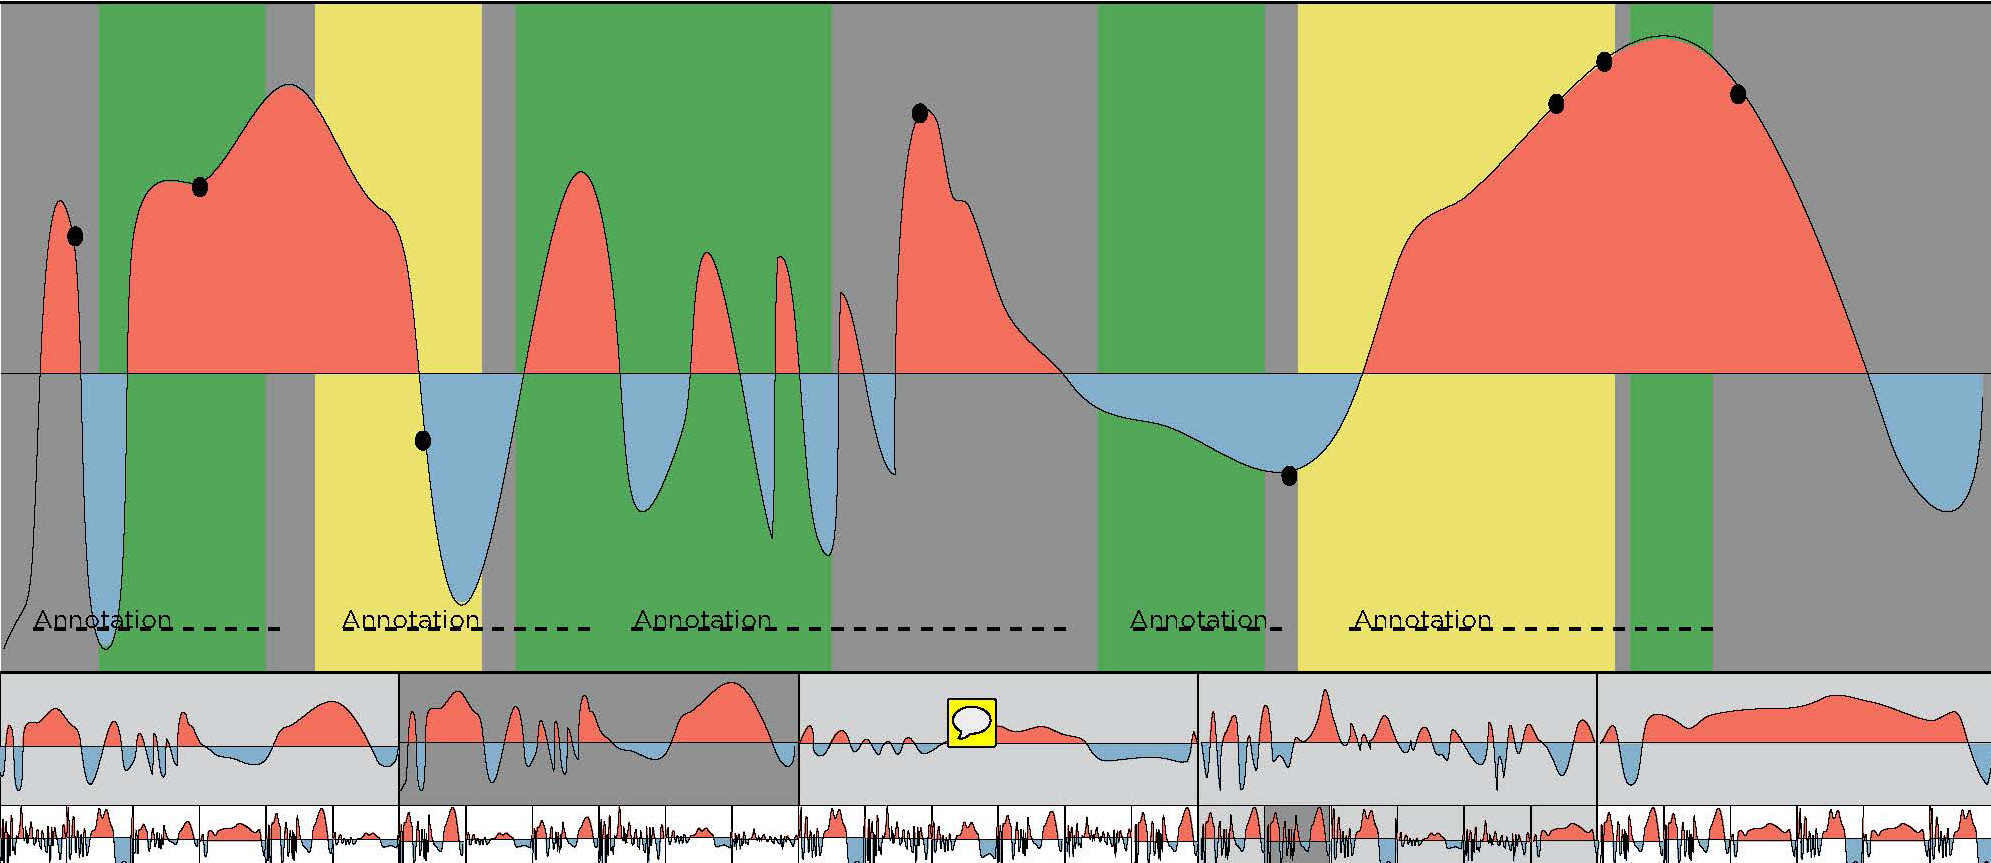
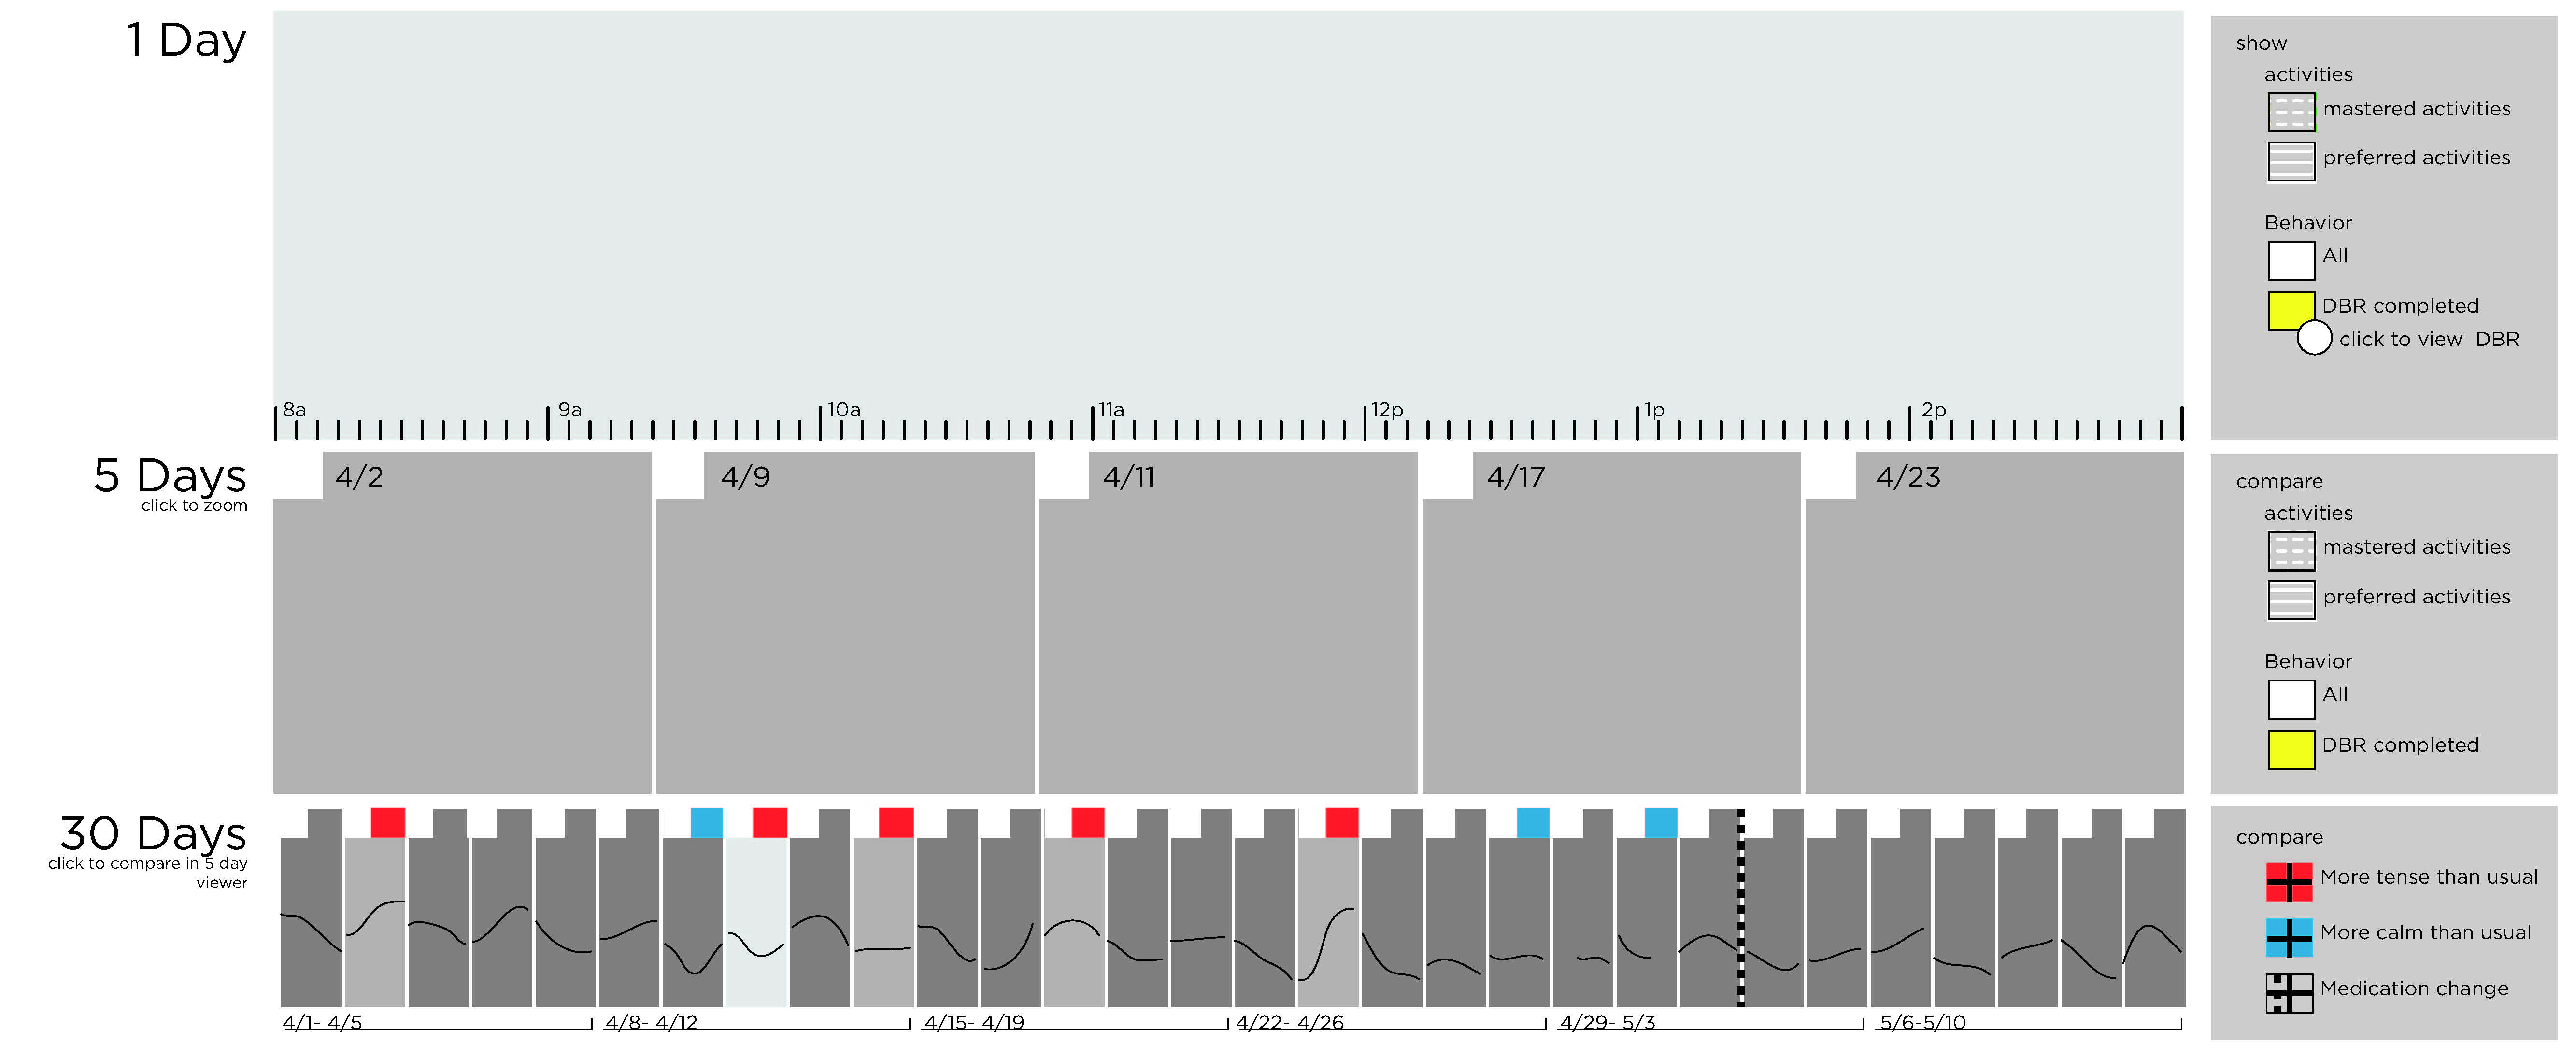
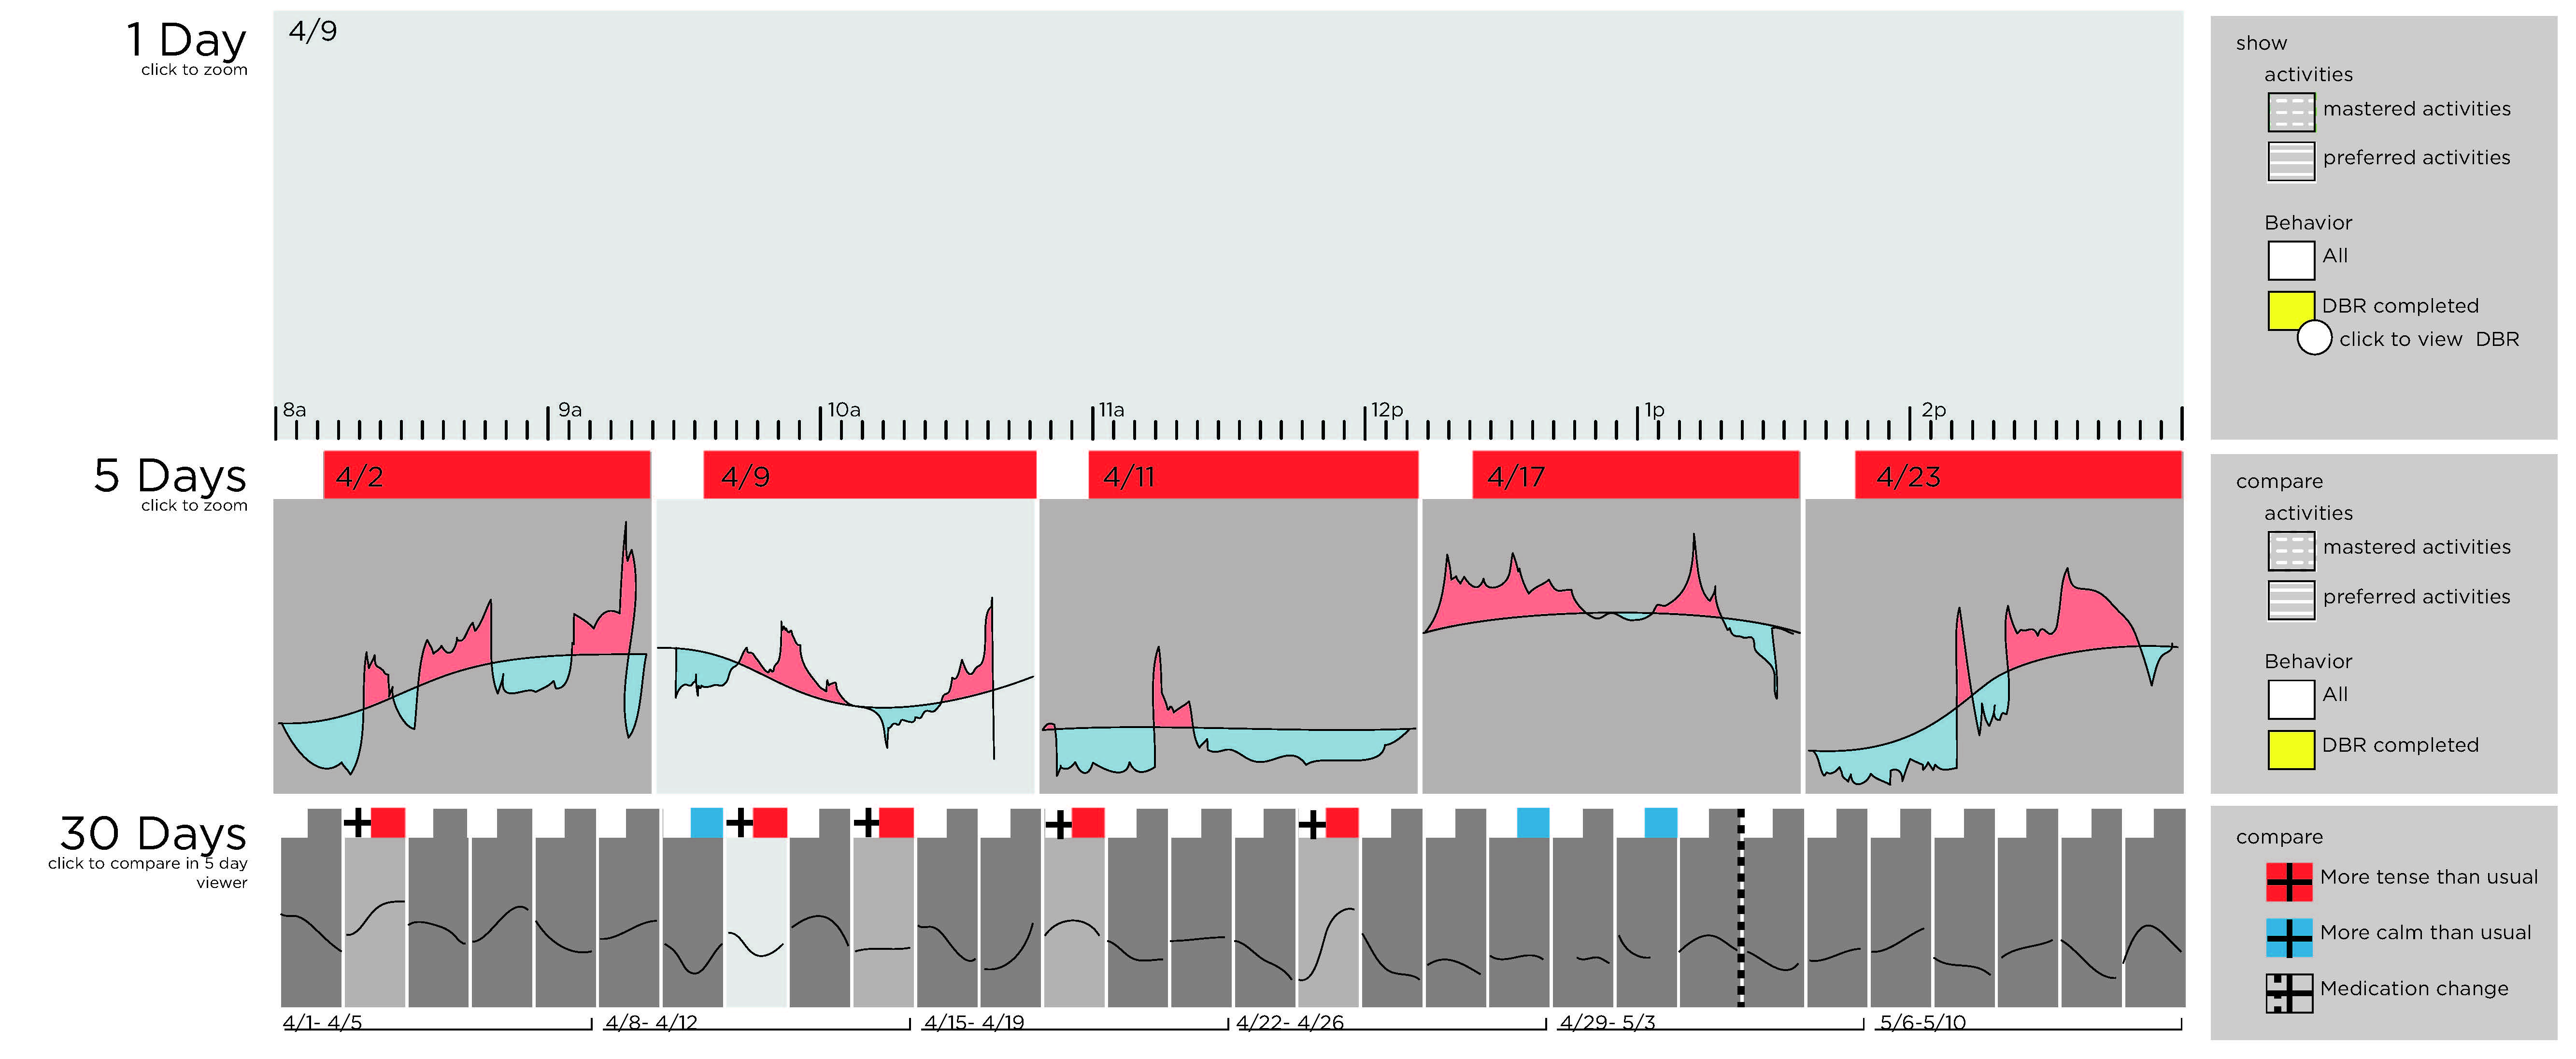
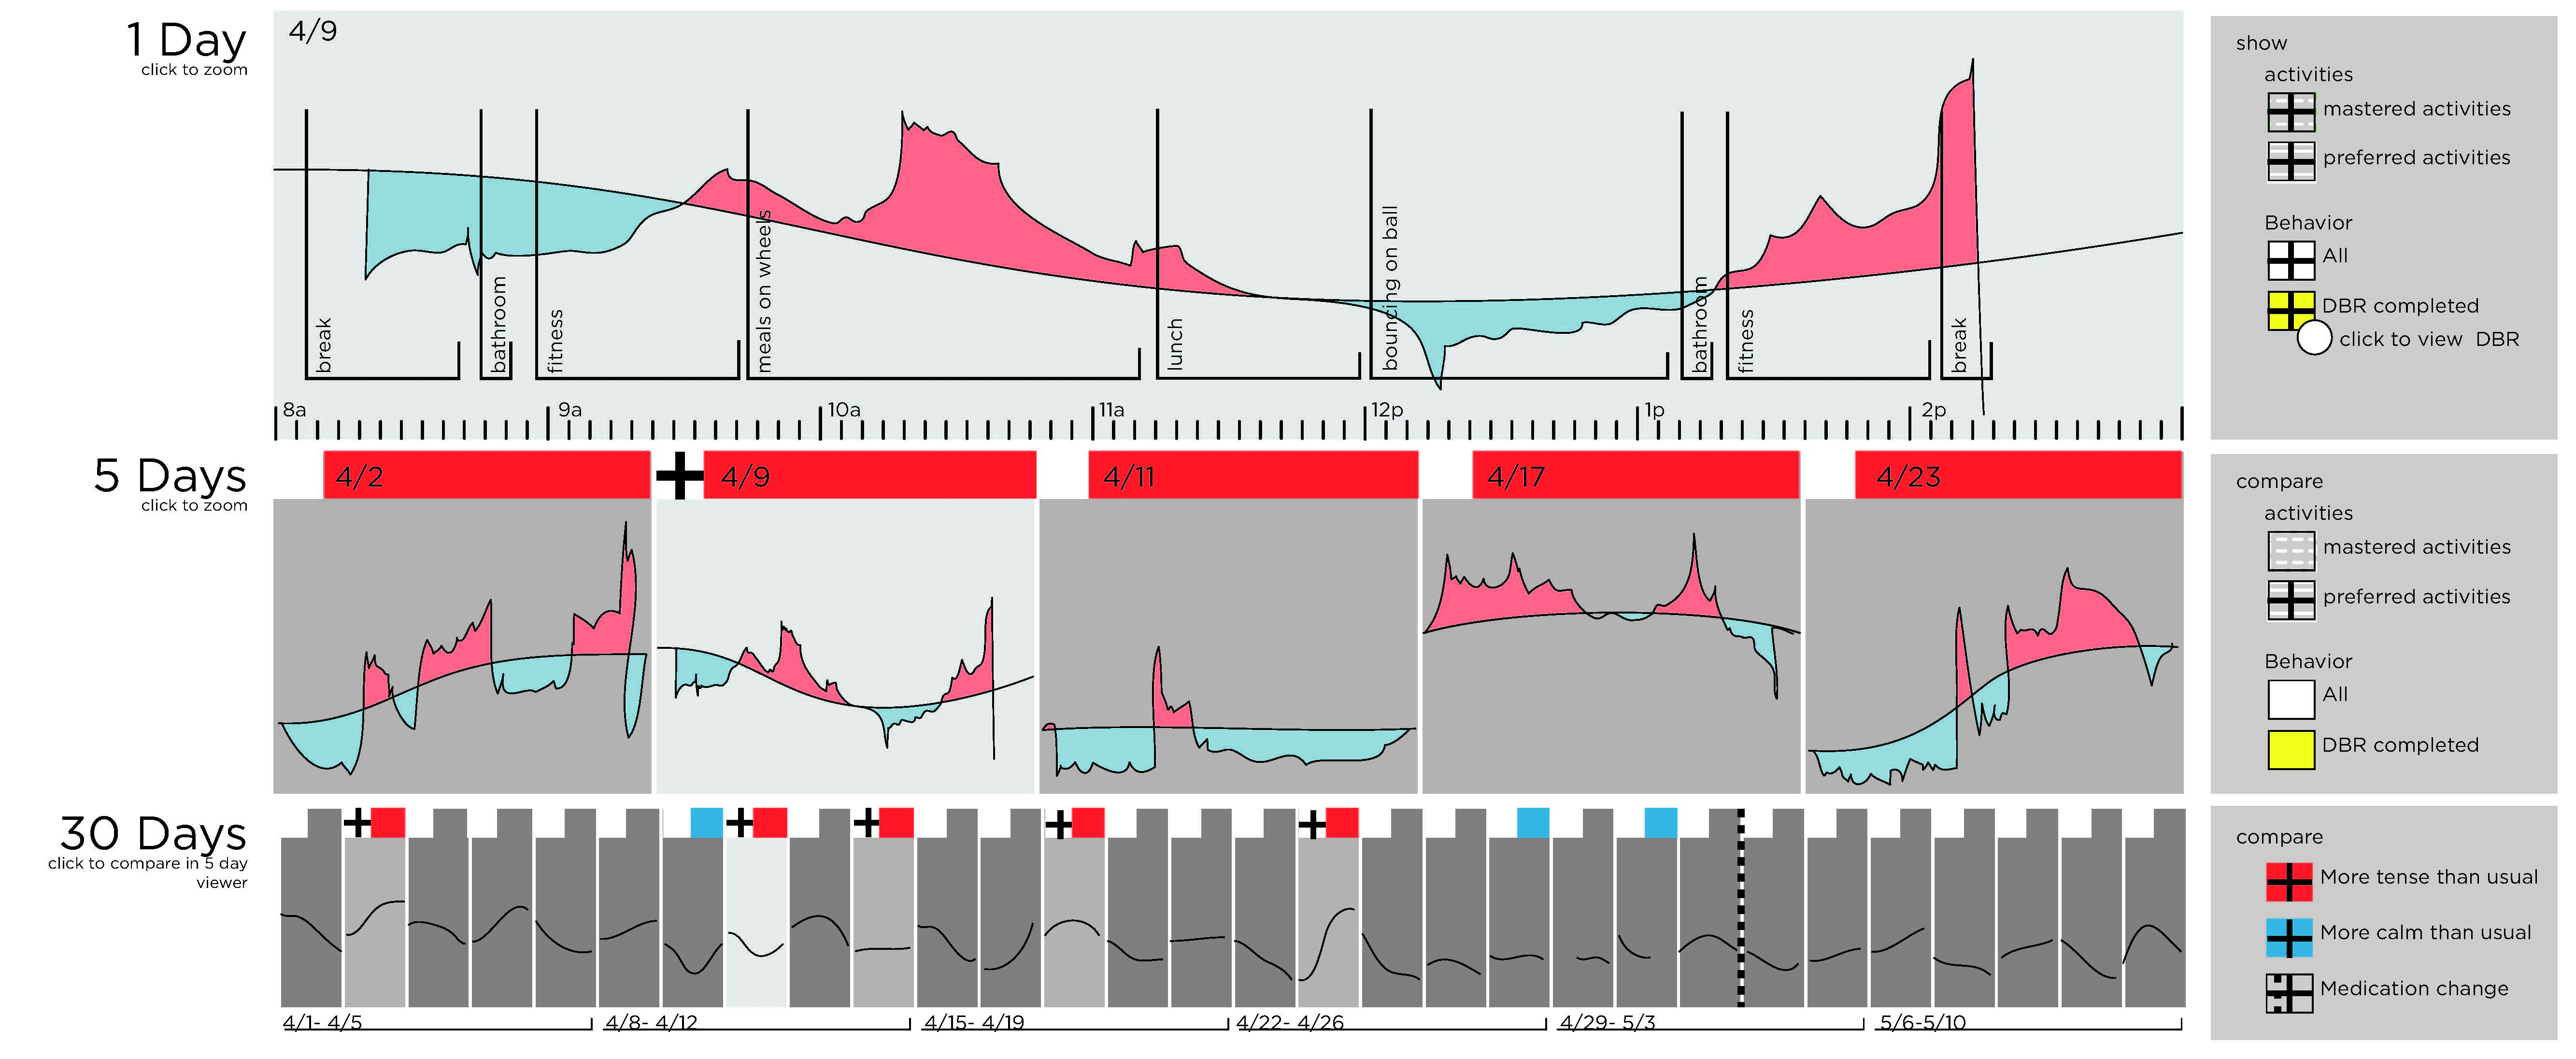
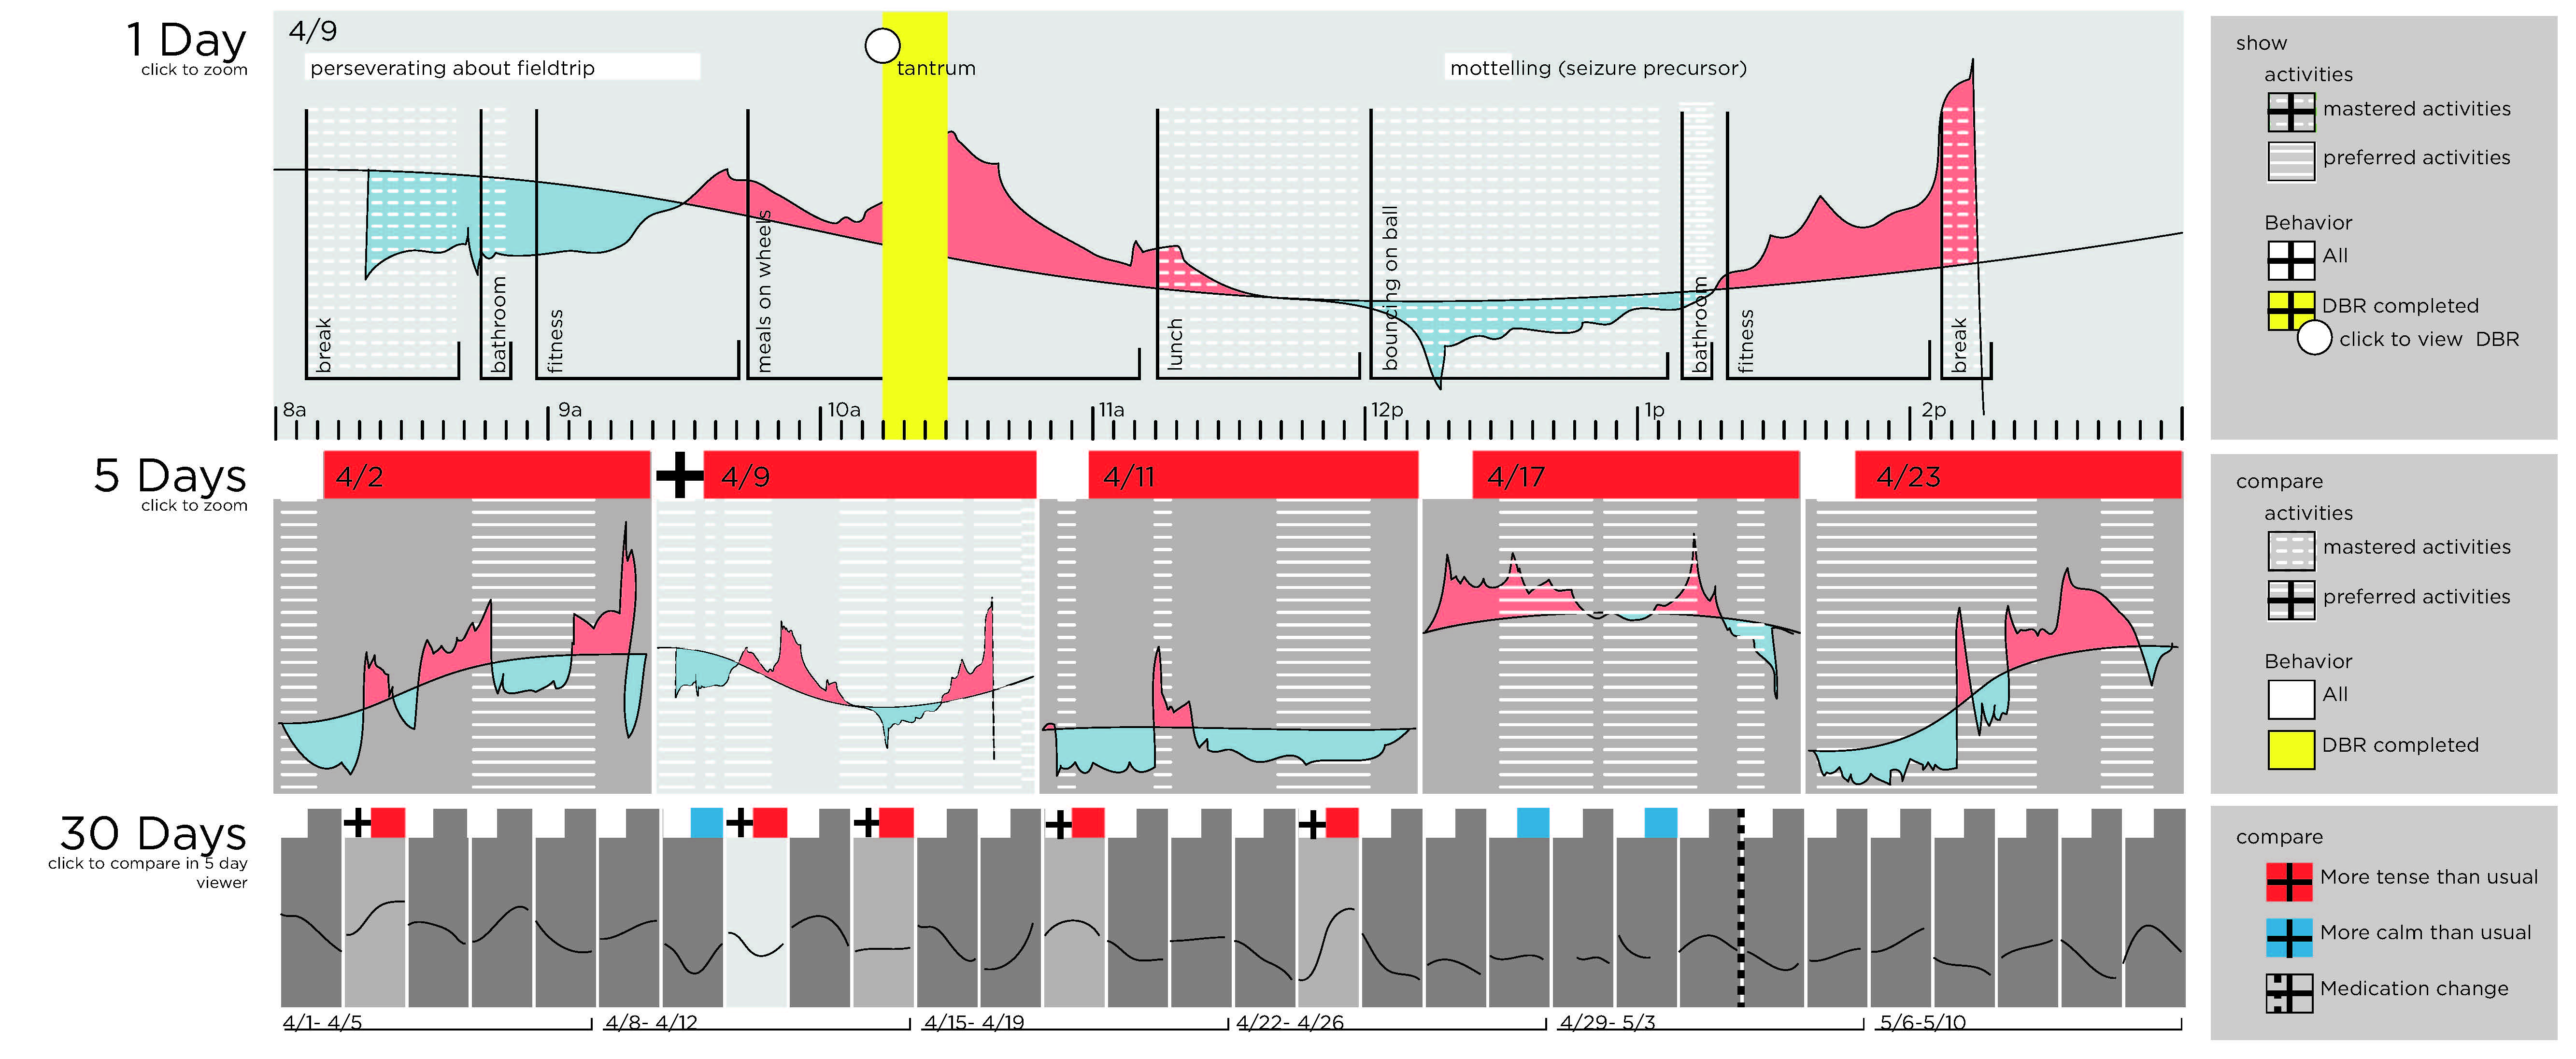
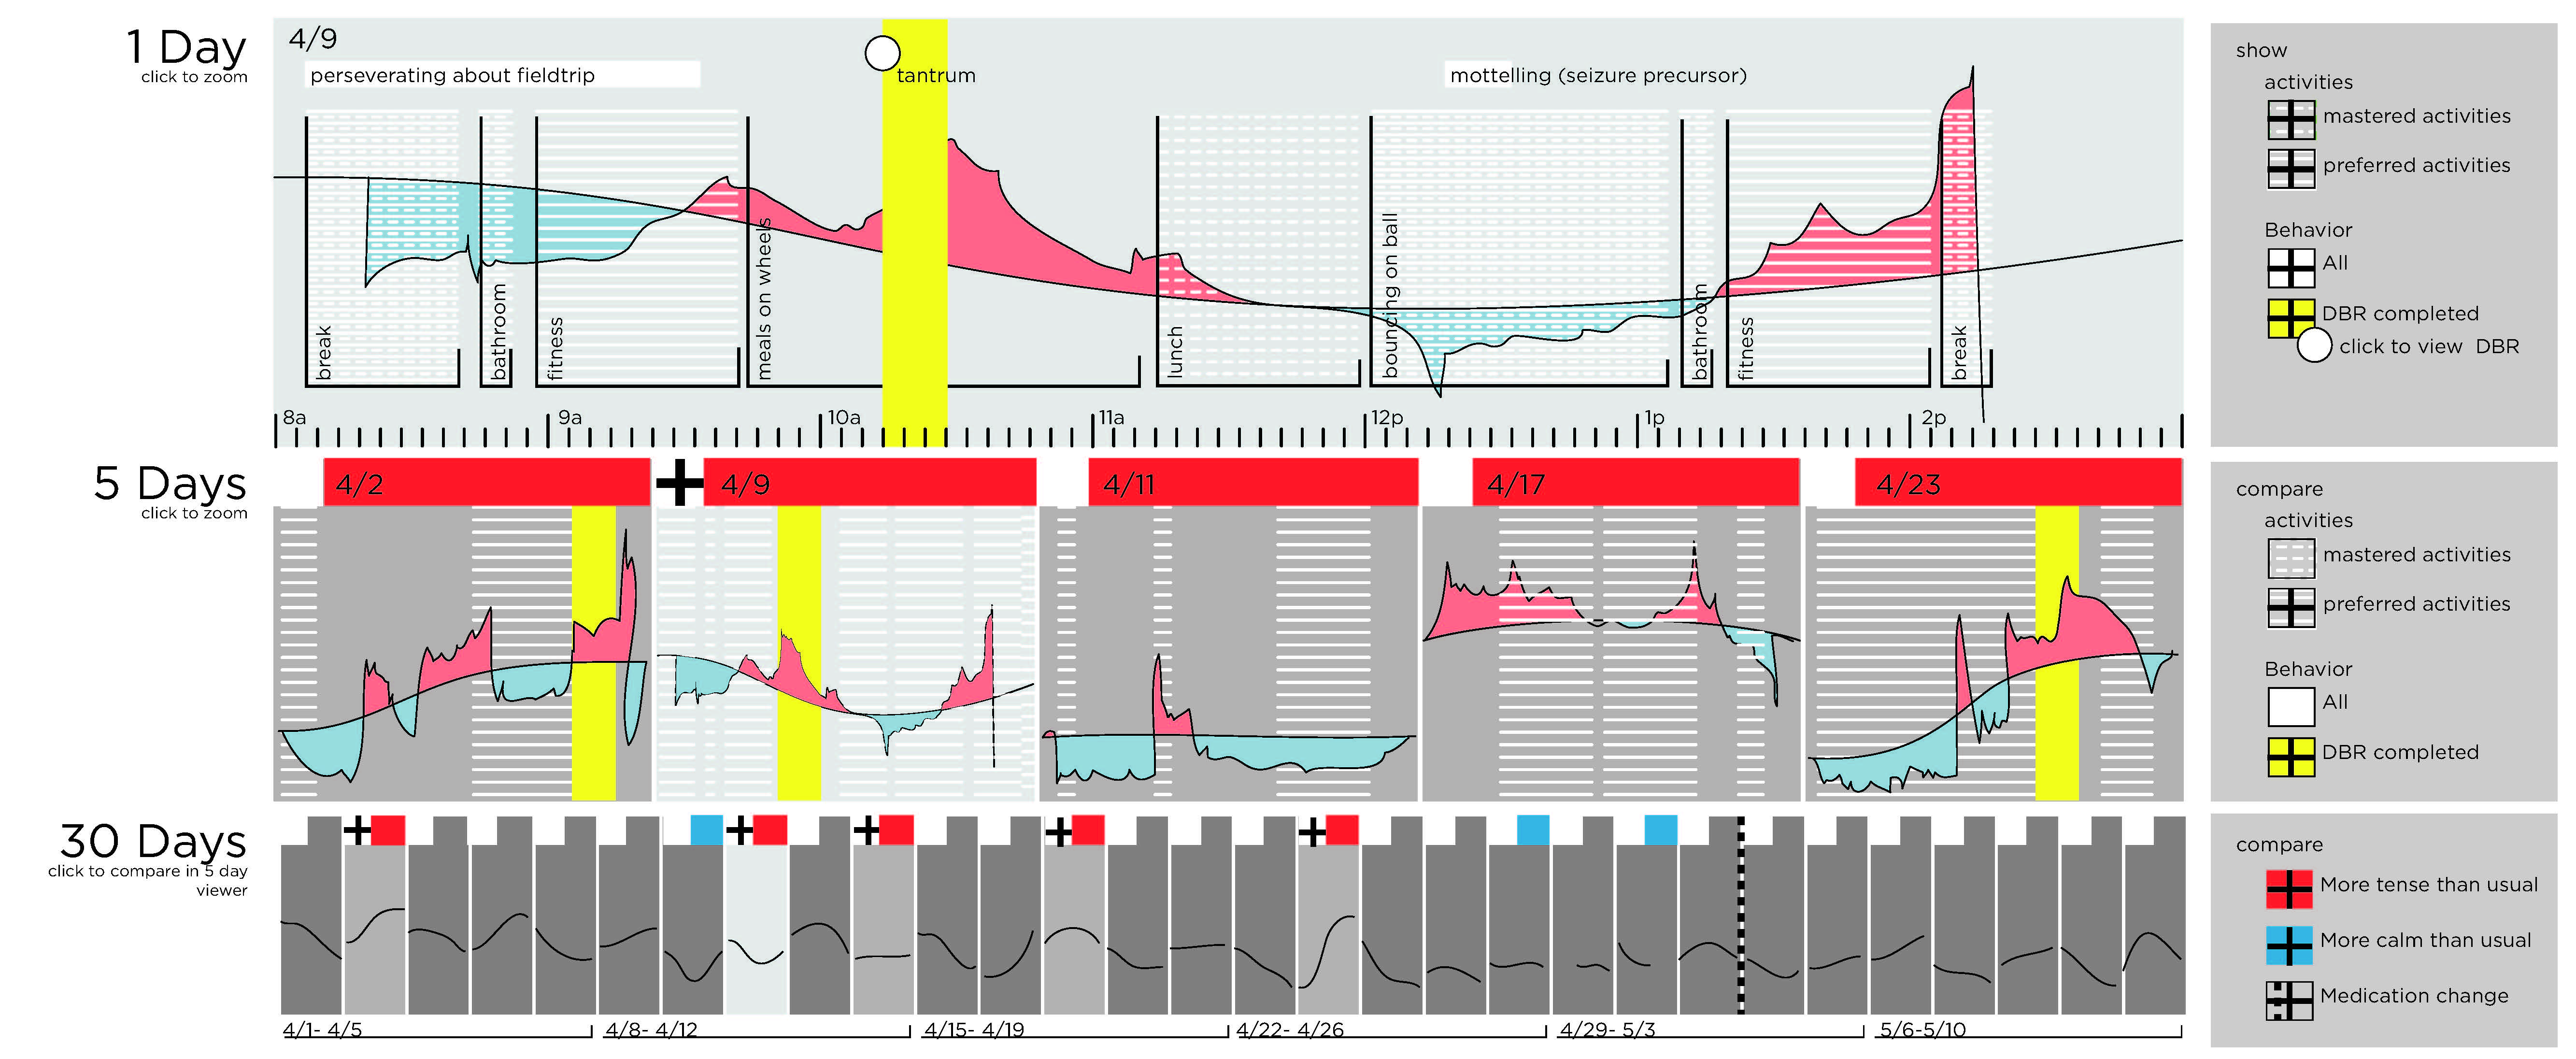
The design uses a series of small multiples to show each day’s data overlaid with the necessary annotations, in a series of time scales. This enables viewing and browsing of the data from the full study period of 2 months, a shorter snapshot of a few days, or a very detailed view of a day or just a few minutes. All of the many types of information that were collected are encoded using color, patterns, and symbols, with a key on the righthand side that also allows users to turn on and off channels of information. This tool was built using processing, an open source library for artists and designers to work with Java programming.
— Process —
To begin this project I conducted interviews with psychologists and researchers, as well as classroom teachers, about how they wanted to use the data.
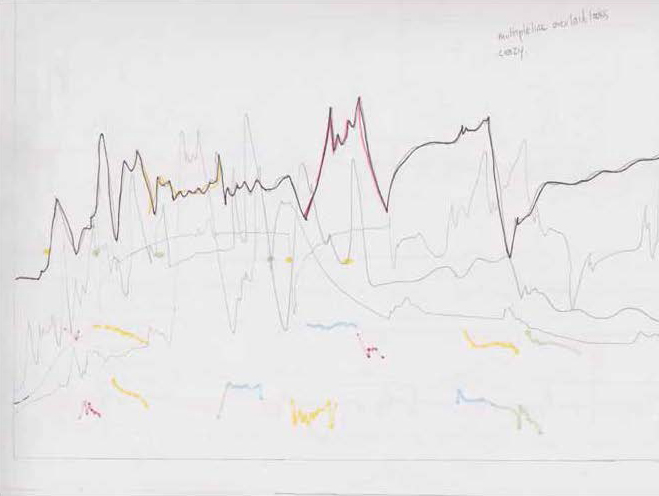
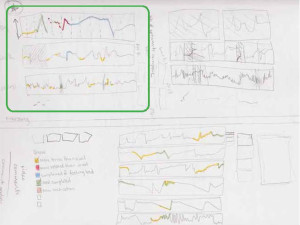
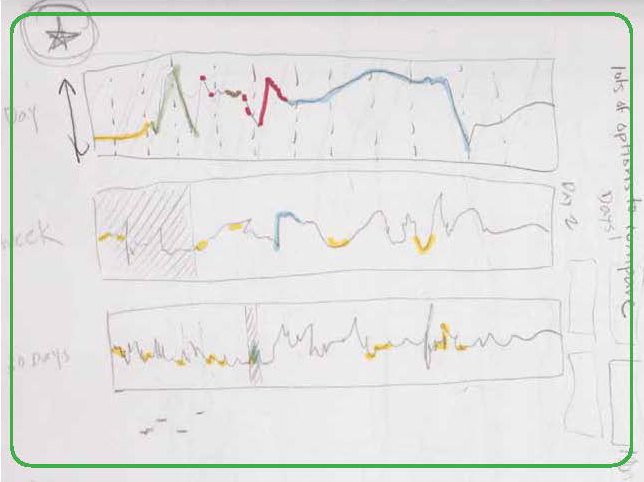
Based on those interviews I began with a series of sketches of basic ideas for how to display and encode the data. The idea to use a series of different time scales emerged early on, as it would enable the user to dig deeper and deeper into the data without losing the context.
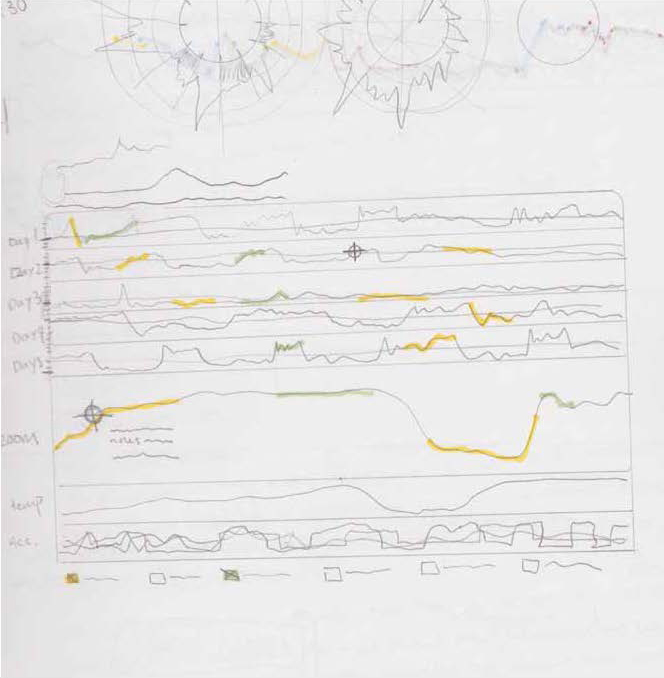
A radial plot seemed like an idea worth exploring, but ultimately took up too much space and wasn’t very easy to explore. The idea did return in the tools for sleep data and personal physiology.
In these sketches you can see increasing resolution around the idea of the series of timelines, as well as how to overlay annotation data and notes.
These sketches enabled user testing of the design I ultimately chose to go with.